What Makes Up the Mana Cost of a Card
April 14th, 2024 by Rohan Rao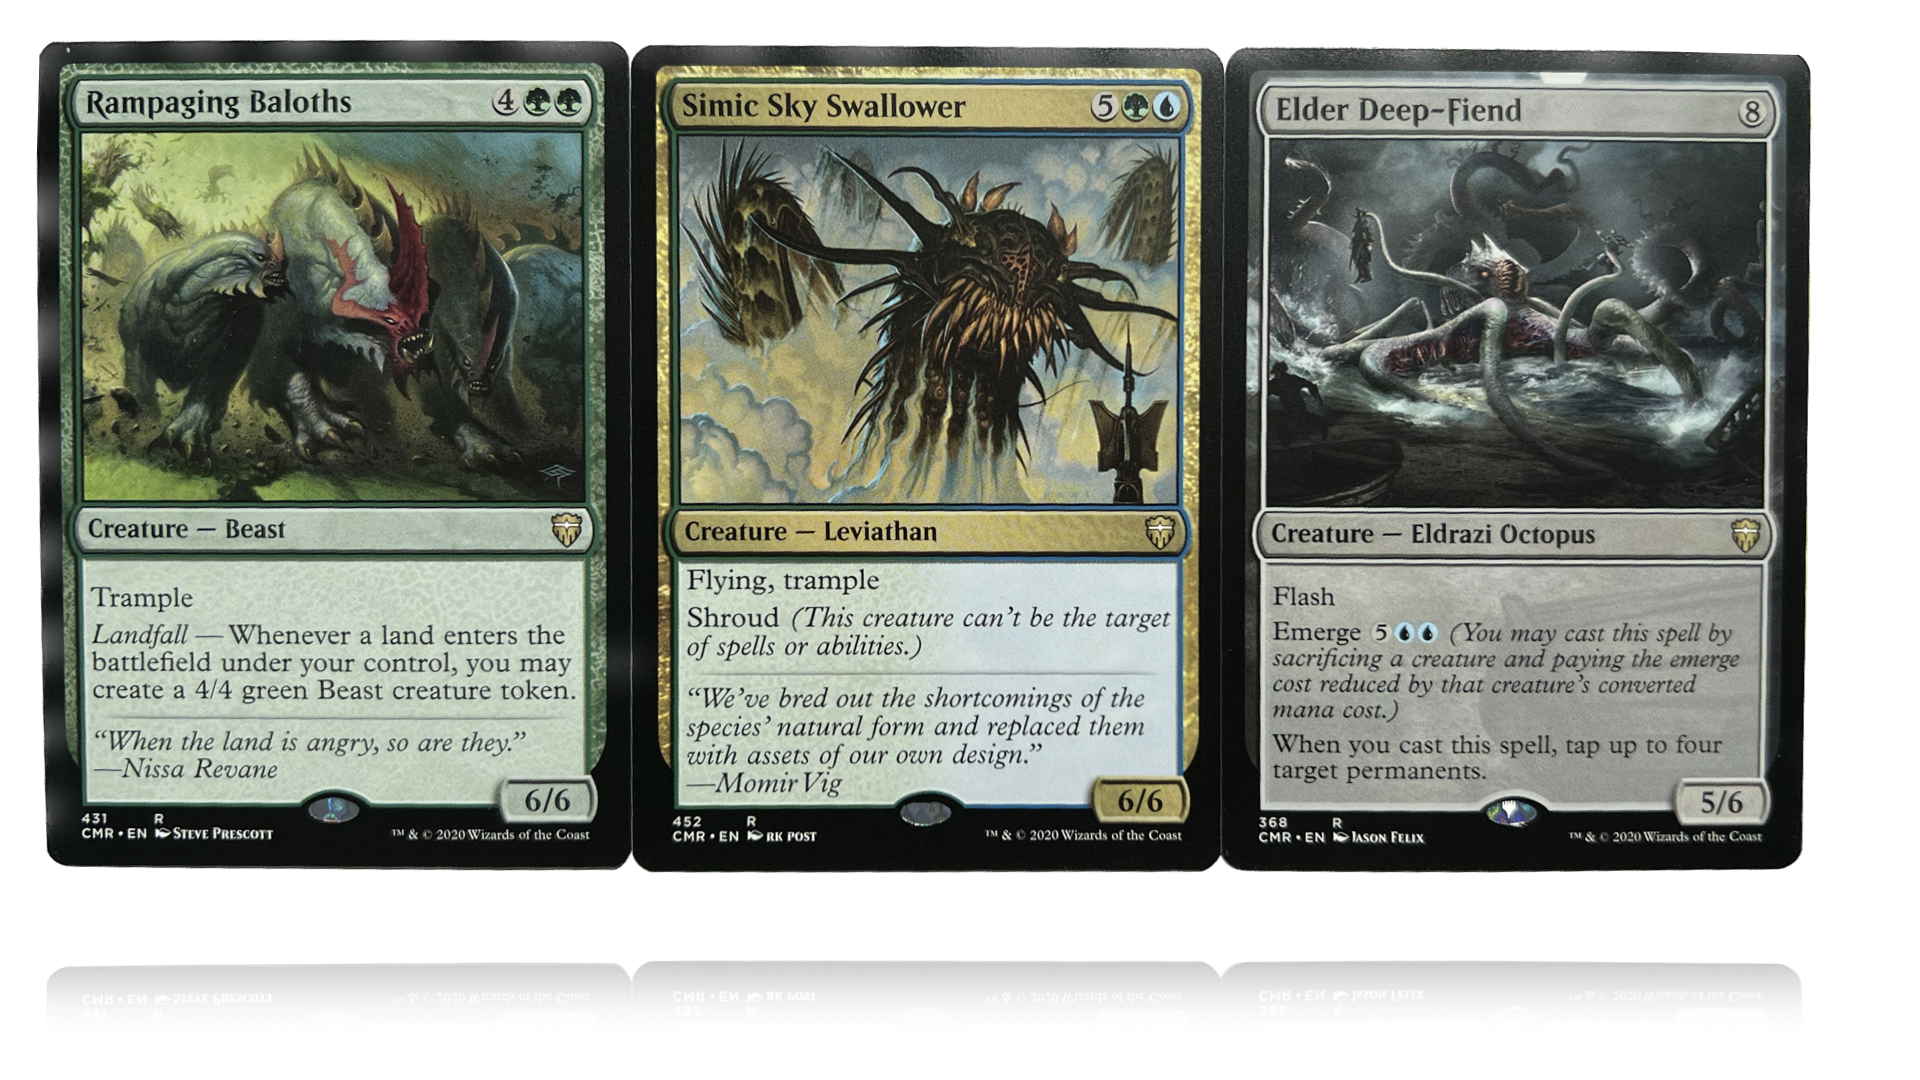
Magic The Gathering Card Mana Cost
Magic the Gathering (known as Magic or MTG) is a popular card game. From Wikipedia:
A player in Magic takes the role of a Planeswalker, a powerful wizard who can travel (“walk”) between dimensions (“planes”) of the Multiverse, doing battle with other players as Planeswalkers by casting spells, using artifacts, and summoning creatures as depicted on individual cards drawn from their individual decks.
Of interest in this post are the creatures being summoned. (Some examples above):
The general anatomy of a creature card involves a cost (the units of which are ‘mana’) on the top right of the card. The creature has a power (the damage it is able to deal to an opposing entity), toughness (the amount of damage the creature is able to take in a turn before dying) in the bottom right (Power / Toughness), and text on the card that involves keywords and other properties that the card has.
How good is a card?
In general this is a pretty hard question. Lots of this is deck dependent but generally higher power and higher toughness make a card stronger and certain keywords can also improve a card’s performance. Generally though these attributes lead to a higher mana cost. I’m interested in looking at the cost (in mana terms) of these power / toughness + common keyword attributes. Mana technically has colors (a card might cost 2 red mana and 1 white mana) but we are going to just look at the converted mana cost (CMC) so we are just interested in the net amount of mana that a card costs.
Data Cleaning
We load the data from the card json into a dataframe. We exclude cards that have \(power > 10\) or \(toughness > 10\). I expect that as the card gets arbitrarily strong it can’t cost arbitrarily much. Players have 20 health and so (to take an unrealistically extreme example) a card that just has power/toughness = 30/30 is probably just as expensive one with 31/31. Additionally many times the game doesn’t last long enough for a 20 mana card to be played. These practical game considerations make it likely that the models we are thinking of might break down as power/toughness/mana cost get very high.
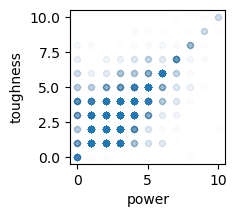
Basic Power Toughness Features
Lets start with just trying to predict converted mana cost using power and toughness data. To start with lets try and linearly model \(cmc = \beta_1 \cdot power + \beta_2 \cdot toughness\) but since we want interpretable betas and power + toughness have some correlation:
Correlation:
0.6919408063936467
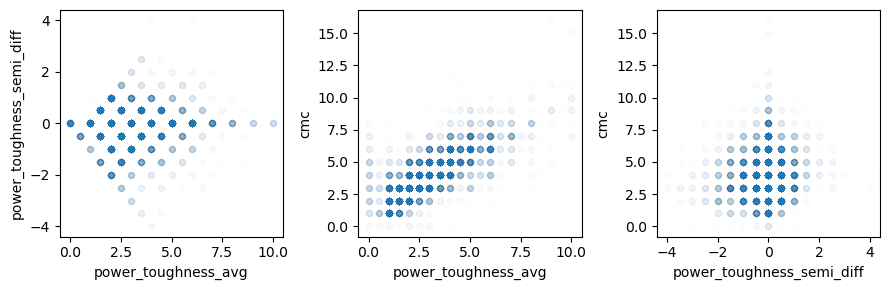
Instead we can pick some more uncorrelated features for some additional interpretability:
- power_toughness_avg \(= 1/2 \cdot (power + toughness)\)
-
power_toughness_semi_diff \(= 1/2 \cdot (power - toughness)\)
corr(power_toughness_avg, power_toughness_semi_diff): 0.01258344325534615 corr(power_toughness_avg, cmc): 0.7664261171205281 corr(power_toughness_semi_diff, cmc): 0.05458996081018814
Linear Model
It seems like these are two promising features to start with. Lets train a linear model where we just model cmc as having some roughly constant betas to power_toughness_avg and power_toughness_semi_diff. By restricting the data as described earlier hopefully this assumption holds more true.
| coef | std err | t | P>|t| | [0.025 | 0.975] | |
|---|---|---|---|---|---|---|
| Intercept | 1.4591 | 0.030 | 47.842 | 0.000 | 1.399 | 1.519 |
| power_toughness_avg | 0.8506 | 0.009 | 91.599 | 0.000 | 0.832 | 0.869 |
| power_toughness_semi_diff | 0.1074 | 0.022 | 4.882 | 0.000 | 0.064 | 0.150 |
We end up with our final fit model: \(cmc = 0.85 \cdot power\_toughness\_avg + 0.1 \cdot power\_toughness\_semi\_diff + 1.46\)
Evaluation
Is our model any good? There are a few different metrics we can use to see how good our predictions are on the test set. MSE or MAE are two common metrics we can look at. Between these I’m more inclined to pick MSE because I think that being 2 away from the true prediction is more than twice worse than being 1 away from the prediction (and I think the cost should be marginally worse the farther away from the true cost we are)
One rationale for this reasoning could be something like, “if we misprice a card by \(n\) mana how much of an impact on the game would it have”. I think that mispricing probably doesn’t have a linear impact on game outcome and so MSE is a more reasonable choice than MAE.
mean sq train error: 1.2200491308371282
mean sq test error: 1.2882065890068048
baseline: 3.0046148357612275
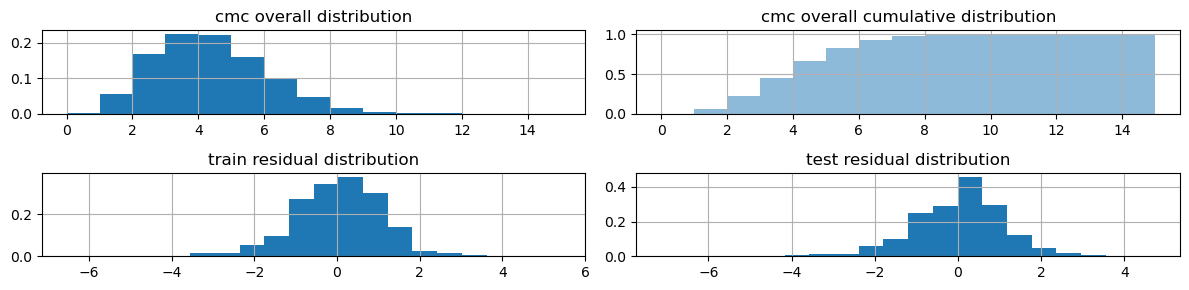
We look at the residuals at different power + toughness levels. It looks like we do something like generally underpredict cmc of low power/toughness creatures and overpredict at higher power and toughness levels
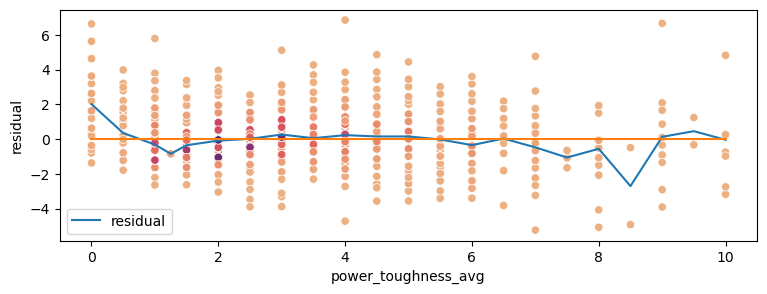
*** coloring generated by a kde with small bandwidth
This isn’t really surprising to us. Creatures with 0 power and 0 toughness often have abilities on the card that determine their value (which wouldn’t be captured by our model) and creatures with very high power and toughness probably come at a discount mana-wise as mentioned earlier
Keyword Features
Lets try and capture some of the text on the card when determining mana cost. Cards sometimes have complicated unique abilities but there are also a set of attributes that many cards share. We can add these features to our model and see how they affect the cost of the card. We will take the top 10 most frequent attrributes.
We end up with (definitions from wikipedia):
- Flying - Creatures with flying cannot be blocked except by other creatures with flying and/or reach
- Trample - An attacking creature with trample which is blocked may deal any excess damage, above what is needed to kill the blocker, directly to the defending player
- Haste - Creatures with the haste ability are able to attack and use abilities that involve the tap symbol on the turn a player gains control of them, instead of waiting until their controller’s next turn
- Vigilance - Creatures with vigilance do not tap when attacking
- First strike - Creatures with first strike deal damage before other creatures in combat
- Flash - creatures or enchantments with flash may be played any time their controller could play an instant
- Defender - Creatures with defender cannot attack
- Reach - Reach is a countermeasure to block creatures with flying
- Lifelink - Permanents with lifelink cause their controller to gain life whenever they deal damage equal to the amount of damage dealt
- Deathtouch - Deathtouch is a static ability that causes a creature to be destroyed as a result of having been dealt damage by a source with deathtouch. In this way, for a creature with deathtouch, any nonzero amount of damage it deals to another creature is considered enough to kill it
Lets take a look at a few correlation matrices to understand how our features relate to each other (and cmc).
Keywords and Corpus Frequency
[('Flying', 2329), ('Trample', 603), ('Haste', 443), ('Vigilance', 362), ('First strike', 296), ('Flash', 283), ('Defender', 258), ('Reach', 220), ('Lifelink', 201), ('Deathtouch', 195)]
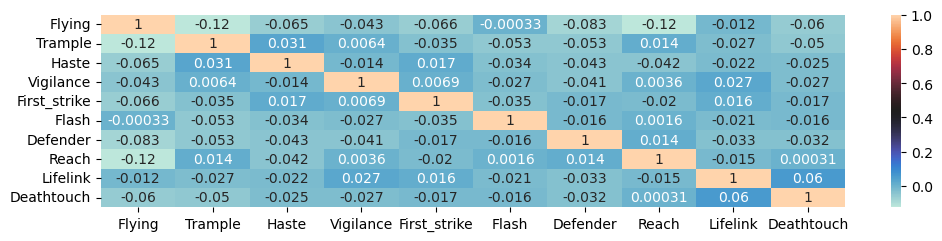
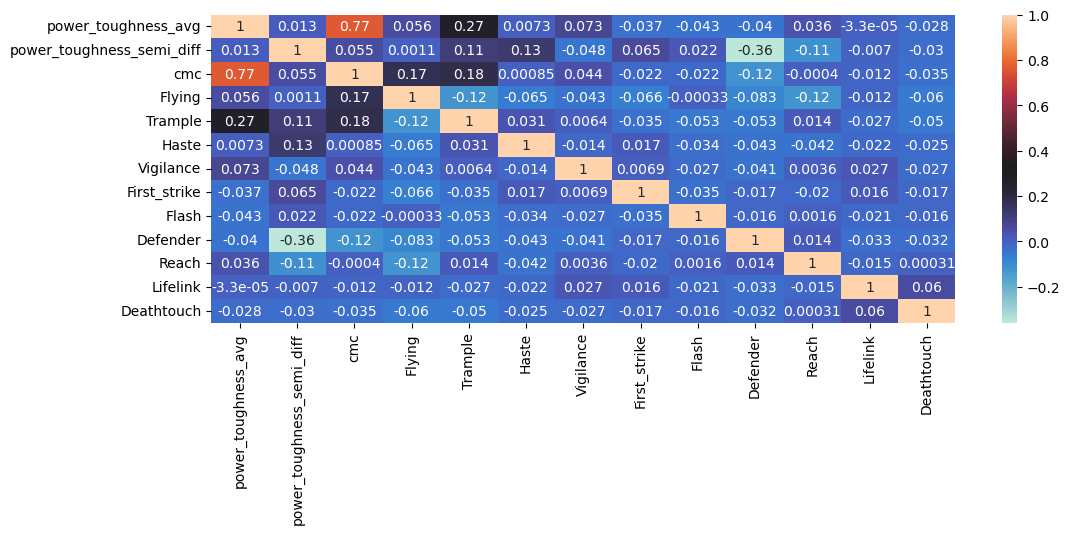
Some of these correlations aren’t that surprising - there isn’t any need to have both flying and reach, defenders generally have much more defense than attack, trample is generally a property of larger rather than smaller creatures, etc. One note is lots of these correlations between two attributes are negative probably bc its unlikely for a card to have multiple attributes. There are also some attributes that are more likely in certain mana colors which could account for some of the correlations.
Lets add these to our linear model
| coef | std err | t | P>|t| | [0.025 | 0.975] | |
|---|---|---|---|---|---|---|
| Intercept | 1.3723 | 0.033 | 41.584 | 0.000 | 1.308 | 1.437 |
| power_toughness_avg | 0.8408 | 0.010 | 87.786 | 0.000 | 0.822 | 0.860 |
| power_toughness_semi_diff | 0.0397 | 0.023 | 1.708 | 0.088 | -0.006 | 0.085 |
| Flying | 0.4464 | 0.031 | 14.209 | 0.000 | 0.385 | 0.508 |
| Trample | -0.0987 | 0.055 | -1.791 | 0.073 | -0.207 | 0.009 |
| Haste | -0.0071 | 0.059 | -0.120 | 0.904 | -0.123 | 0.109 |
| Vigilance | -0.0811 | 0.064 | -1.261 | 0.207 | -0.207 | 0.045 |
| First_strike | 0.1297 | 0.072 | 1.795 | 0.073 | -0.012 | 0.271 |
| Flash | 0.0479 | 0.075 | 0.642 | 0.521 | -0.099 | 0.194 |
| Defender | -0.6973 | 0.082 | -8.545 | 0.000 | -0.857 | -0.537 |
| Reach | -0.0844 | 0.086 | -0.983 | 0.326 | -0.253 | 0.084 |
| Lifelink | -0.0880 | 0.088 | -1.002 | 0.316 | -0.260 | 0.084 |
| Deathtouch | -0.0812 | 0.087 | -0.934 | 0.350 | -0.252 | 0.089 |
Looks like we have a lot of variables whose betas don’t look significant (in the sense that we can’t reject the null for their individual t tests). It’s still worth looking closer at some of the more significant estimated betas.
Attributes like Flying making a card cost more make sense - flying is a good attribute! Defender makes a card cheaper - a card with defender is weaker than a card without defender. Some of the other betas being negative are surprising though. Lets look closer at Trample. It’s possible that because prior to adding these keywords we overpredicted the mana cost of higher power/toughness cards, enough cards that have Trample might be in this region such that giving it a negative coefficient reduced training loss. Similarly I could imagine the other negative coefficients being a product of correlations with power/toughness regions where we overpredicted mana cost. OR theres a bug somewhere in the model.
Because the goal of our model is interpetability, we will do some some feature selection to get features that reduce prediction errors in explainable ways. This means from our above features we will just keep Flying and Defender. We will drop power_toughness_diff just to simplify our model as it’s correlated with Defender.
| coef | std err | t | P>|t| | [0.025 | 0.975] | |
|---|---|---|---|---|---|---|
| Intercept | 1.3773 | 0.031 | 43.919 | 0.000 | 1.316 | 1.439 |
| power_toughness_avg | 0.8376 | 0.009 | 92.111 | 0.000 | 0.820 | 0.855 |
| Flying | 0.4282 | 0.030 | 14.065 | 0.000 | 0.369 | 0.488 |
| Defender | -0.7716 | 0.077 | -10.027 | 0.000 | -0.923 | -0.621 |
We end up with our final fit model: \(cmc = 0.84 \cdot power\_toughness\_avg + 0.45 \cdot Flying -0.7181 \cdot Defender + 1.35\)
mean sq train error: 1.1666154162991207
mean sq test error: 1.2044607308198987
baseline: 3.0046148357612275
Overall it looks like for the most part we can estimate the mana cost of the card from the average of power and toughness with around half a mana bump if the card has Flying and between 0.7 discount for a Defender.
Discussion!
There are many other factors that could better predict cmc (mana color, other card text, creature type, etc). We stuck to some basic card attributes to get an interpretable rule of thumb to figure out how attributes of a card affect mana cost. Hopefully this can provide a baseline to evaluate cards against. (maybe a 2/2 creature costing 4 mana needs to have some good abilities for it to be worth it, or maybe a 3/3 creature with flying for 2 mana is a good deal). Although we reported MSE on a held out test set the goal here was more to have a model to provide a better understanding of why cards cost what they do - so this wasn’t a purely predictive modeling exercise.
In some runs of the models the test error is lower than the train error - my guess is just because the test error has higher variance than the train error.
Usage Policy
This post is is unofficial Fan Content permitted under the Fan Content Policy. Not approved/endorsed by Wizards. Portions of the materials used are property of Wizards of the Coast. ©Wizards of the Coast LLC.”