Which Moonboard Holds Are Hard
August 8th, 2023 by Rohan Rao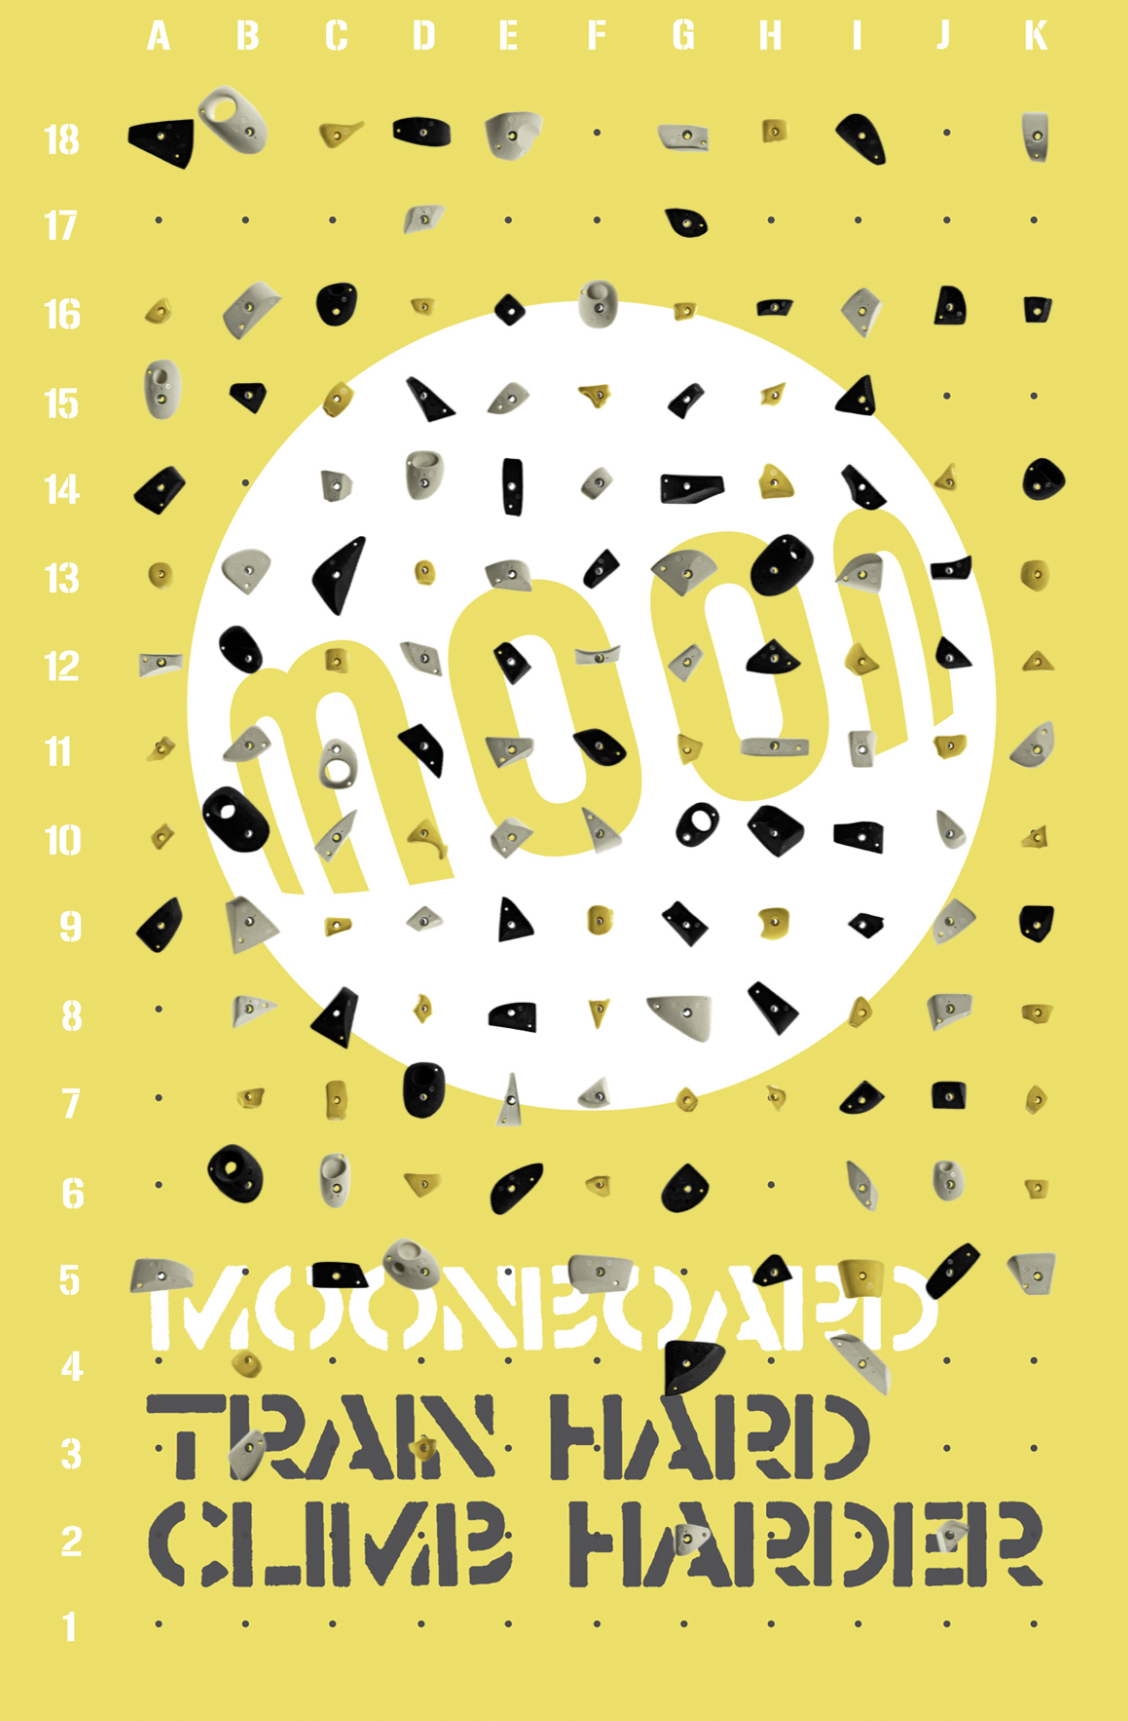
The MoonBoard
Bouldering is a sport which consists of climbing on a short series of holds on a wall which form a route to be completed. These routes are generally referred to as bouldering “problems” and consist of holds that a climber needs to start on, and a hold that they must finish on. Along the way from the start to the end, a climber can use other holds in the route.
A popular training tool for this sport is a MoonBoard (https://www.moonboard.com/). This is a standardized wall with an array of holds with LED lights indicating which holds are “on” (usable) for each problem. This flexible framework allows users to create and share their own boulder problems on this wall. I’ve included an example of the MoonBoard setup and an example problem.
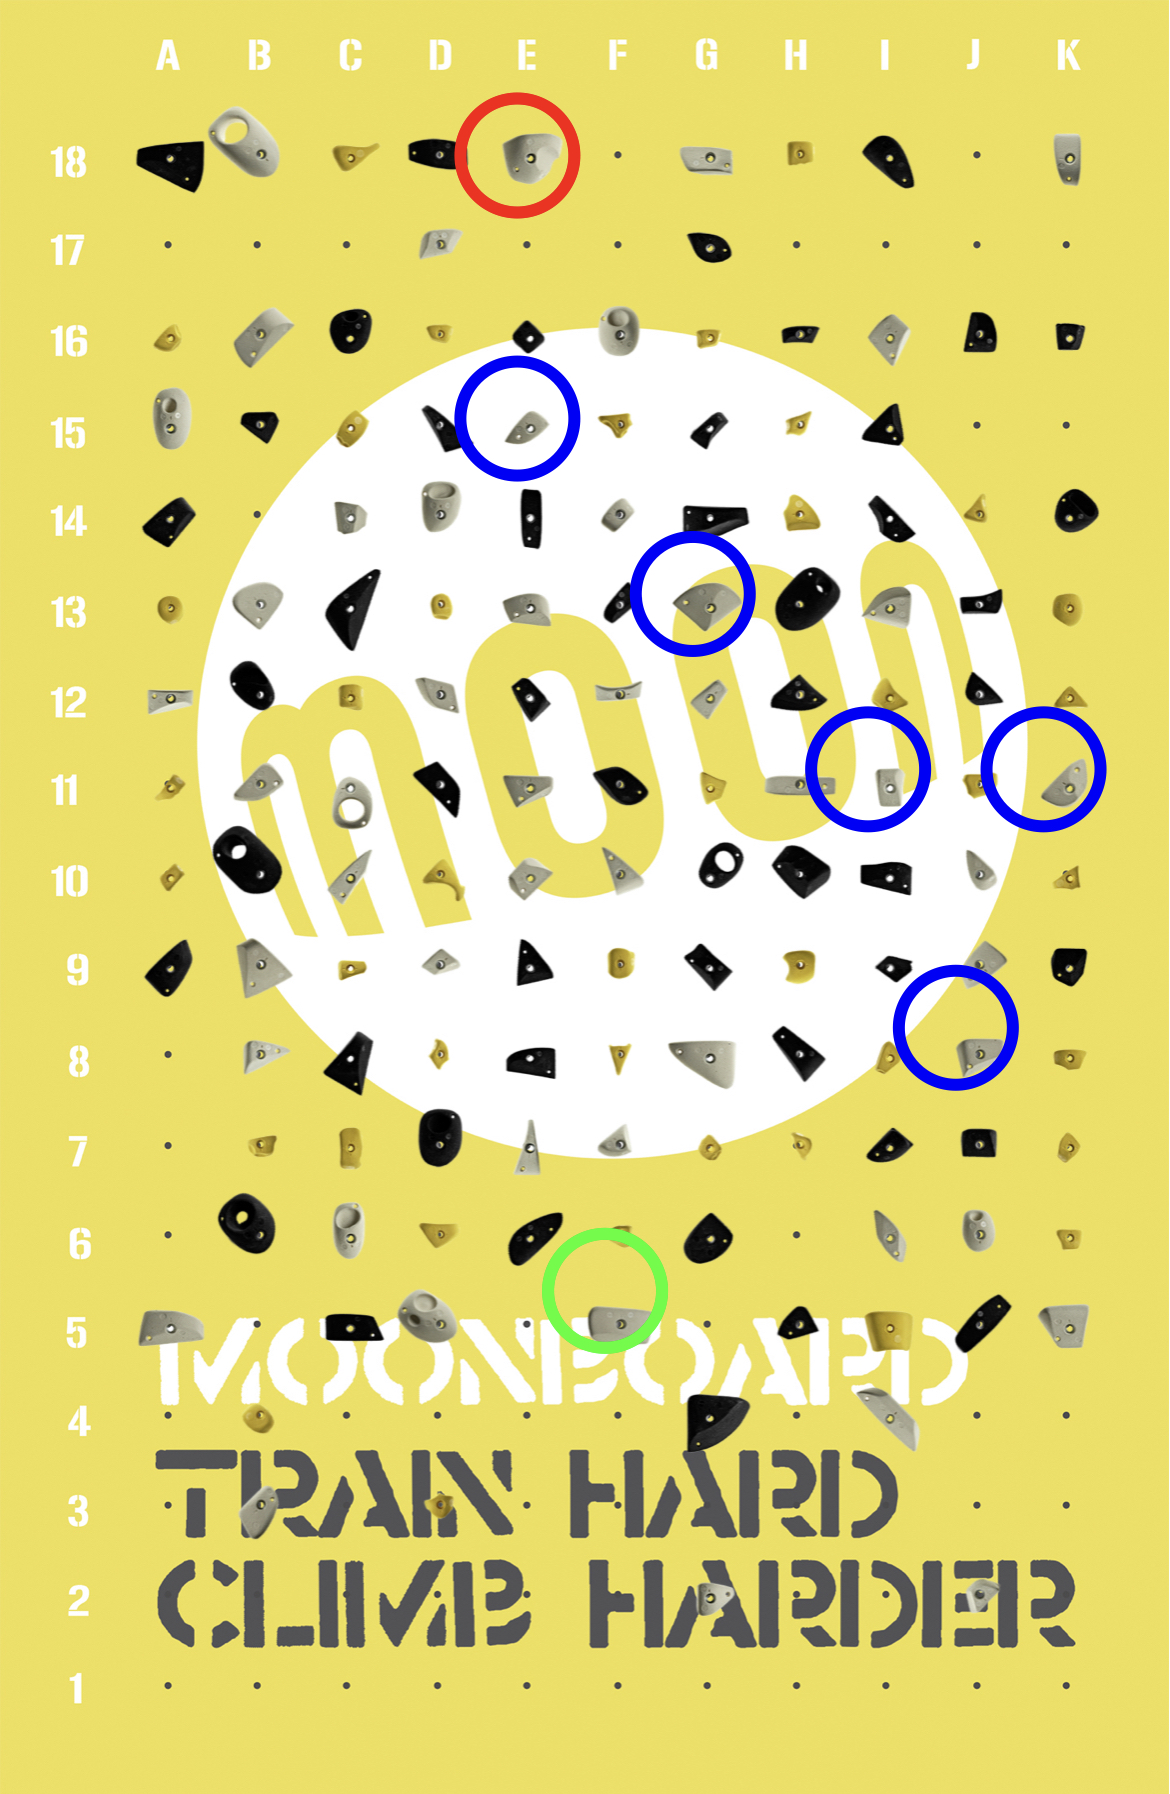
The first image at the top of this post indicates the moonboard holds and layout and the one directly above indicates a single route on the moonboard (called Wuthering Heights by Ben Moon). The circled holds are the holds that the climber is allowed to use for the problem. The climber starts using the hold on the green circle and ends on the red circle. We can refer to the holds on the board by using the coordinates \(\{A,...,K\} \times \{1,...,18\}\)
Climbing Difficulty Scales
Some routes are harder than others to climb. Routes are often accompanied by a “grade”. There are two popular grading systems for boulders.
- V Scale \(\mathbb{V} = \{V0, V1, ... V13, ...\}\)
- Fontainebleau Scale \(\mathbb{F} = \{6A, 6A+, 6B, 6B+, 6C, 6C+, 7A, ...\}\)
Here’s a quick conversion between colloquial difficulty, V-Scale, and Font Scale (excluding some grades at the bottom end, and some grades at the very top of the scale)
| Informal difficulty | V-Grade | Font-Grade |
|---|---|---|
| Beginner | V4 | 6B |
| Beginner | V4 | 6B+ |
| Beginner | V5 | 6C |
| Beginner | V5 | 6C+ |
| Beginner | V6 | 7A |
| Intermediate | V7 | 7A+ |
| Intermediate | V8 | 7B |
| Intermediate | V8/V9 | 7B+ |
| Intermediate | V9 | 7C |
| Intermediate | V10 | 7C+ |
| Advanced/Expert | V11 | 8A |
| Advanced/Expert | V12 | 8A+ |
| Advanced/Expert | V13 | 8B |
An immediate difference is that the Font scale is more nuanced at easier grades. The number portion of the Font Scale also seems to line up better with the informal difficulty classification.
Factors Determining Difficulty
The two components of a route are the types/shape of holds chosen (are they easy to grip?) and their positioning (how hard are the movements between the holds to get to the top?)
In this post I’m going to try and score holds based on their difficulty using information about the grades of routes set on the Moonboard
Here we will try to focus on only modeling how much the choice of holds (ignoring positioning as best we can) contributes to a climb’s difficulty.
Data
Here we use the scraped Moonboard Route data published here https://github.com/jrchang612/MoonBoardRNN
And process it into a binary matrix of which holds on the board are on or off. For example here is the data point representing a route (and the climb name).
no-legs-campus
[[0 0 0 0 0 0 1 0 0 0 0]
 [0 0 0 0 0 0 0 0 0 0 0]
 [0 0 0 0 0 0 0 0 0 0 0]
 [0 0 0 0 1 0 0 0 0 0 0]
 [0 0 0 0 0 0 0 0 0 0 0]
 [0 0 0 0 0 0 1 0 0 0 0]
 [0 0 0 0 0 0 0 0 0 0 0]
 [0 0 0 0 0 0 0 0 0 0 0]
 [0 0 0 0 1 0 0 1 0 0 0]
 [0 0 0 0 0 0 0 0 0 0 0]
 [0 0 0 0 1 0 1 0 0 0 0]
 [0 0 0 0 0 0 0 0 0 0 0]
 [0 0 0 0 0 0 0 0 0 0 0]
 [0 0 0 0 0 1 0 0 0 0 0]
 [0 0 0 0 0 0 0 0 0 0 0]
 [0 0 0 0 0 0 0 0 0 0 0]
 [0 0 0 0 0 0 0 0 0 0 0]
 [0 0 0 0 0 0 0 0 0 0 0]]
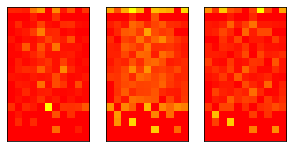
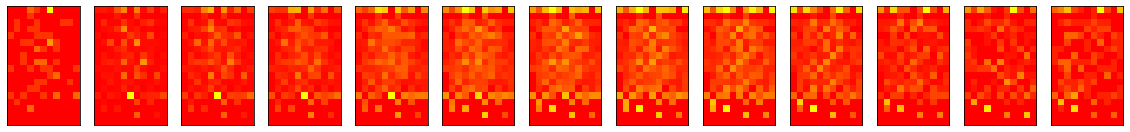
Here are some hold usage count heatmaps for different grade buckets
Hold Usage % for Each Informal Grade
Counts: [22416, 7624, 259]
Hold Usage % for Each V Grade
Counts: [10037, 8376, 4003, 3035, 3154, 1052, 383, 179, 51, 29]
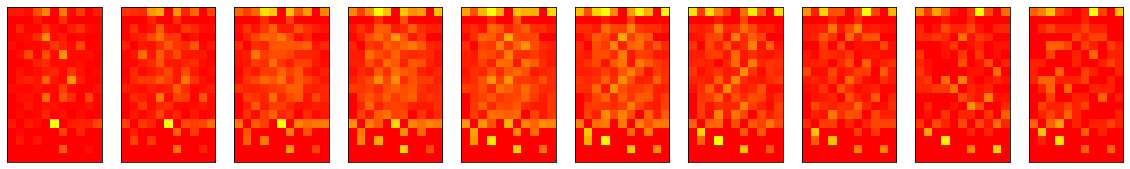
Hold Usage % for Each Font Grade
Counts: [8, 10029, 3794, 4582, 4003, 3035, 1539, 1615, 1052, 383, 179, 51, 29]
Model
Lets consider an unobservable latent random variable \(L\) representing the difficulty of a climb given info about which holds are used to set it (smaller \(L\) means easier climb). We will model \(L = f(holds\_included) + \epsilon\), where \(f\) is some deterministic function of the holds included and \(\epsilon\) is a 0 mean random variable representing the uncertainty we have over the other aspects of a climb that might contribute to its difficulty.
First lets think about how to pick \(f\).
All things equal, a climb with no holds is incredibly difficult (probably impossible), and adding holds to a climb keeps making it easier. Thus we would like the betas of the model with respect to toggling hold inclusion to be negative. Lets pick a simple model \(f\) where each hold has a score \(\leq 0\) and \(f\) is the sum of scores of the included holds. This choice of \(f\) has the property we want (adding holds makes a climb easier and the more negative a hold’s score is the more we expect it to make a climb easier.
\[L = \sum_{h \in route\_holds} w_h + \epsilon; w_i \leq 0\]Where \(w_h\) are constants/scores associated with the holds. Once we find an optimal choice of \(w_h\)’s we will have per-hold scores that represent the difficulty of a climb.
Next we want to pick a reasonable choice of \(\epsilon\).
We can first think of the grade of a climb \(g(L)\) where \(g\) does something simple like
\[g_{\mathbb{F}}(l)= \left\{ \begin{array}{ll} 6B & l\leq c_1 \\ 6B+ & c_1\leq l\leq c_2 \\ ... \\ \end{array} \right.\] \[g_{\mathbb{V}}(l)= \left\{ \begin{array}{ll} V4 & l\leq d_1 \\ V5 & d_1\leq l\leq d_2 \\ ... \\ \end{array} \right.\] \[g_{informal}(l)= \left\{ \begin{array}{ll} beginner & l\leq s_1 \\ intermediate & s_1\leq l\leq s_2 \\ ... \\ \end{array} \right.\]With this in mind we will look at two possibilities for \(\epsilon\). We’ll consider a Logistic distribution (a classic choice in these applications) A logistic distribution is symmetric about its mean and has heavier tails than a normal distribution.
This all boils down to an logit ordinal regression model.
Training
From our dataset of user generated routes we want to estimate the parameters of our model.
We split the set of routes in our dataset into train/test pairs (0.65 train) and estimate our parameters using MLE (via statsmodel). (although since each route in our dataset is unique, the holds being used from route to route aren’t independent, this is for the most part OK since conditioned on the hold usage we can model the grades as being independent allowing maximizing the log-liklihood to be relatively straightforward). We want our hold scores to all be non-positive so we’ll constrain our optimization
Evaluation
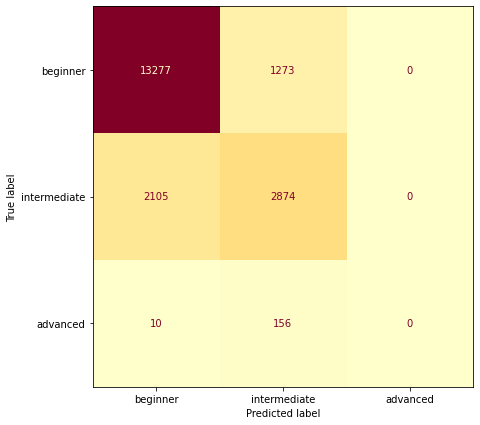
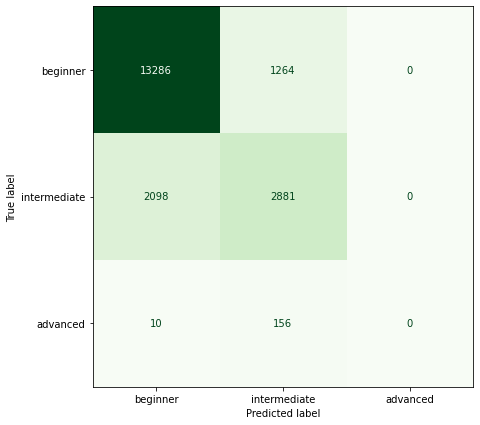
For each of our three models we look at the confusion matrices of the results.
Confusion Matrix Informal Grades:
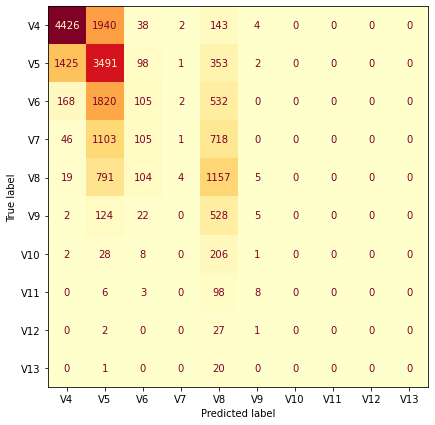
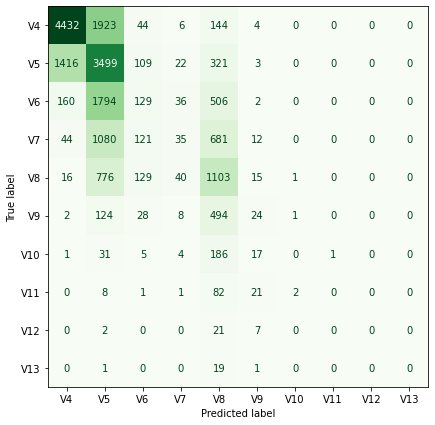
Confusion Matrix V Grades:
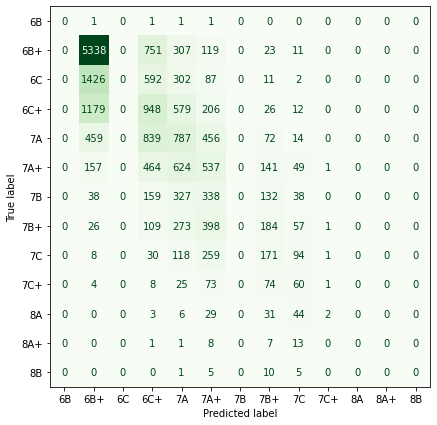
Confusion Matrix Font Grades:
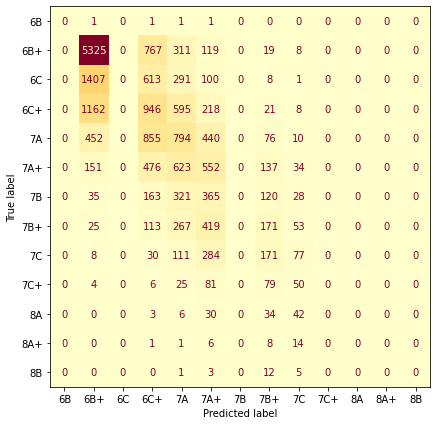
It looks like generally we seem to predict harder grades for harder routes (but have a hard time predicting anything harder than 7C). It looks like there are also some gaps at certain grades (6C+, 7B) where we never predict those grades. I haven’t thought too much about this but I’d guess that it is an artifact of using an ordered model and data that isn’t linearly separable.
What if we allow positive scores
This feels unintuitive in terms of our model (i.e adding a hold could make a climb harder) but I’d expect any accuracy gains to come from correlations between the usages of certain holds.
Confusion Matrix Informal Grades:
Confusion Matrix V Grades:
Confusion Matrix Font Grades:
Looks like constraining the betas to be negative doesn’t lead to a much worse model! (The unconstrained model is able to predict some harder grades but still has a hard time predicting anything above V9/7C)
Hold Scores
We overlay the estimated hold weights under each model on the moonboard to end up with some scores for each hold!
To put the scores in a natural space we multiply by \(-100\) so a score represents “goodness”. We also will use the Font grade model (as there didnt seem to be a major difference between that and the V grade (the informal difficulty model seemed to be worse)
-100 * Font Hold Scores
[[  0.   33.4  12.2  57.8  77.2   0.   79.6   7.8  44.1   0.    0. ]
 [  0.    0.    0.   19.9   0.    0.   30.3   0.    0.    0.    0. ]
 [  2.1  45.6  10.6  17.3  76.8   0.    0.   42.7  90.8  30.9  43.1]
 [ 64.6  62.9  51.2  70.7 139.3  52.   77.    0.    7.1   0.    0. ]
 [ 62.3   0.   35.4  40.1  28.1 145.4  68.6  37.5 108.1   0.   75.1]
 [  9.5  79.9 108.1  61.5 149.1  29.  184.3  32.2  28.2  60.1  23.4]
 [  0.    0.   72.1  86.   66.   14.4  72.2   0.   59.4   2.    0. ]
 [  0.   75.2  59.2  27.7  83.6  59.2  26.7  93.5  95.3   0.   20. ]
 [ 11.9  82.5  64.4  69.  108.6  35.8  17.6 170.3 121.8   0.    0. ]
 [ 29.5   0.    0.   81.    0.   46.6 113.   83.9   0.   16.9 102.1]
 [  0.   52.6  22.1   6.6 157.7   1.6 111.9  48.2   0.  139.2   0. ]
 [  0.    0.   76.7  47.6  55.   67.9   0.    0.1   0.6  45.5   0. ]
 [  0.    7.3  18.    1.1  59.3   4.6  36.9   0.   15.9   0.    0. ]
 [ 13.9   0.   28.5  26.1   0.  143.    0.   39.4  73.2  21.9  41.7]
 [  0.    0.    0.    0.    0.    0.   77.5   0.   29.7   0.    0. ]
 [  0.    0.    0.    9.6   0.    0.    0.    0.    0.    0.    0. ]
 [  0.    0.    0.    0.    0.    0.    8.3   0.    0.    0.    0. ]
 [  0.    0.    0.    0.    0.    0.    0.    0.    0.    0.    0. ]]
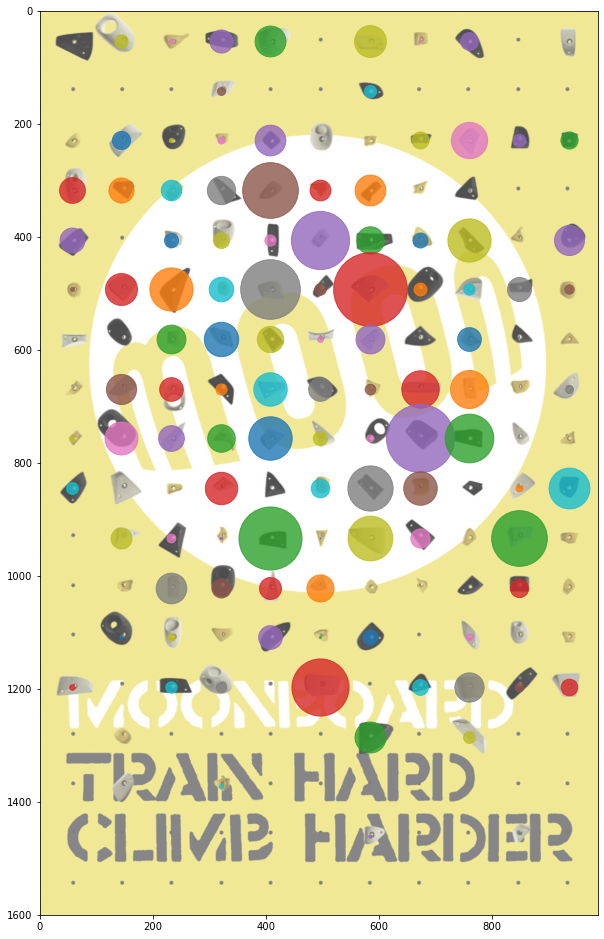
The circle radius indicates the goodness of the hold - the colors don’t mean anything! I’ve also included the raw matrix above.
Its definitely worth mentioning that we tried to just model how easy a climb was from the holds that are used. There is certainly more to a climb than just this but hopefully these scores give a rough starting point to guess how hard a climb might be. (For example, this route contains some “bad” holds but maybe the geometry of the climb makes it easier etc.)